Control and cut production cost with quality service monitor
These days parcel volumes are at an unprecedented high and as a result, sorting and distribution capacities are under tremendous pressure. Investments and implementations in higher capacity are well underway, and now it is time to secure efficient use of the added capacity to keep production costs low, increase earnings profitability and improve competitive edge.


A realistic precise overview
Based on real deliveries
Lower production cost

Individual itemand national performance
QSM™ enables you to measure and manage efficiency and quality across your delivery network. Using data already available from BARCODE scans, OCR scans and RFID scans, QSM™ analyses and reports on parcel and mail items performance based on the product service. thus detecting costly inefficiencies and process and network failures.
QSM™ reports right from individual parcel/package/letter performances to national performance based on product and service types as well as network logistics elements in the end-to-end network. QSM™ holds all master data on product service types as well as process and cycle times on production and delivery plans.
A well-proven solution
QSM™ is available as a cloud service for fast, easy deployment with seamless importing of master data and standard APIs to establish the necessary data sources.
QSM™ is well-proven with many years of reporting and performance refinement through the current user community of national postal operators such as Australia Post, Canada Post, PostNord, Post Norway, and Royal Mail using QSM™ to improve efficiency and quality in letters and packages (e-commerce).

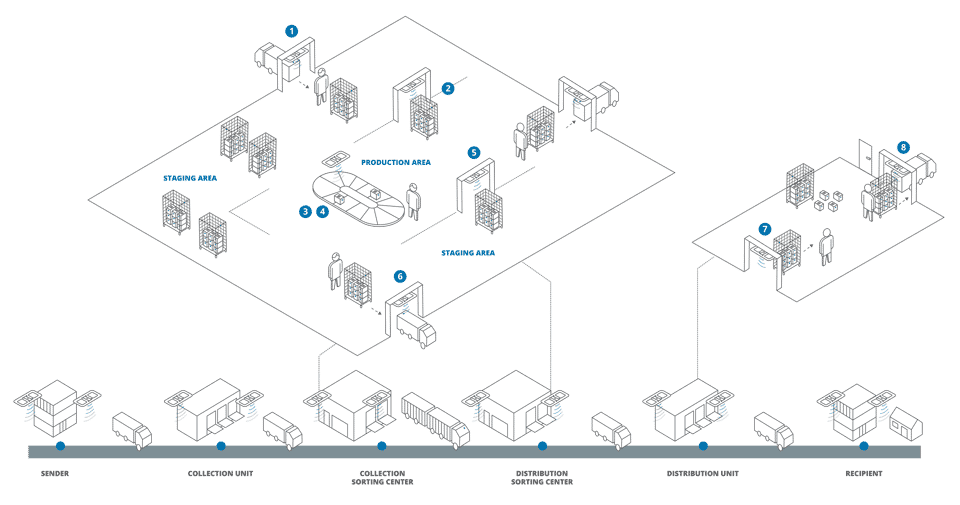
Automatic data flow with QSM™
Step by step example of the QSM™ process:
Step 1: Arrival and staging scans
Step 2: Into production scans
Step 3: Container assign and open scans
Step 4: Container assign and close scans
Step 5: Out of production scans
Step 6: Departure scan
Step 7: Delivery unit arrival scans
Step 8: Delivery unit departure scans
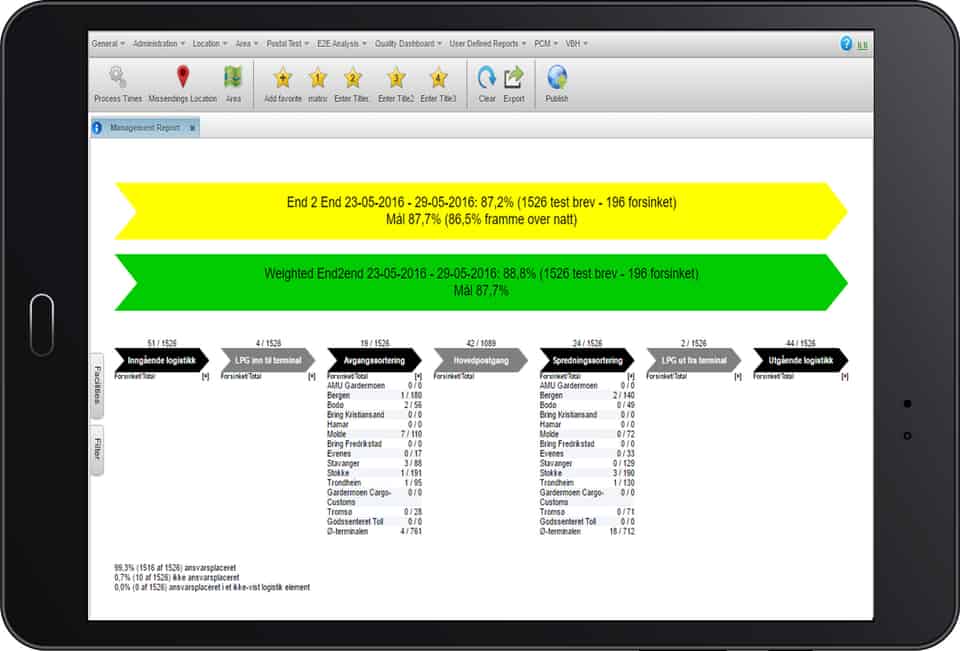
Complete performance overview
Performance per site
On the micro-level, performance per site and all production processes from arrival, staging, sorting, staging and transport and any process within are covered in the site performance reports
Performance by single parcel
The trip and trend reports show the whole End2End performance of individual parcels related to product type, service type, and other relevant attributes on single trips and multiple trips over time to track rectifications impact, etc.
Cloud QSM™ basic
Based on the user’s unique selection of mail attributes, time period, and logistics elements, the user will be able to analyze and report on:
- Percentage of on-time e2e delivery
- Which product types have the largest deviation from process times
- How many items were delayed in the domestic logistics chain and where
- Throughput times for products, graphical overview of when products arrived and left centers and offices and how long they stayed there
- An automated process imports items into the QSM based on a generic import format, containing the most common information regarding an End2End test item.
- The End2End calculation process uses the built-in postal rules in QSM to determine if an item is on time or delayed for the End2End stretch.
"You can’t manage what you can’t measure”
Peter Drucker, Austrian management consultant, educator, and author
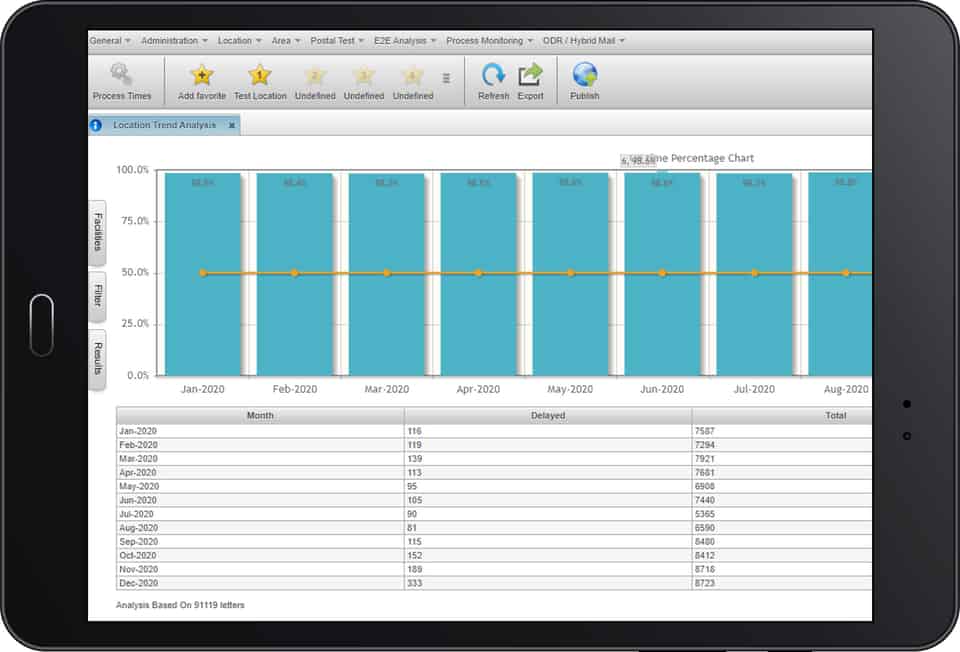
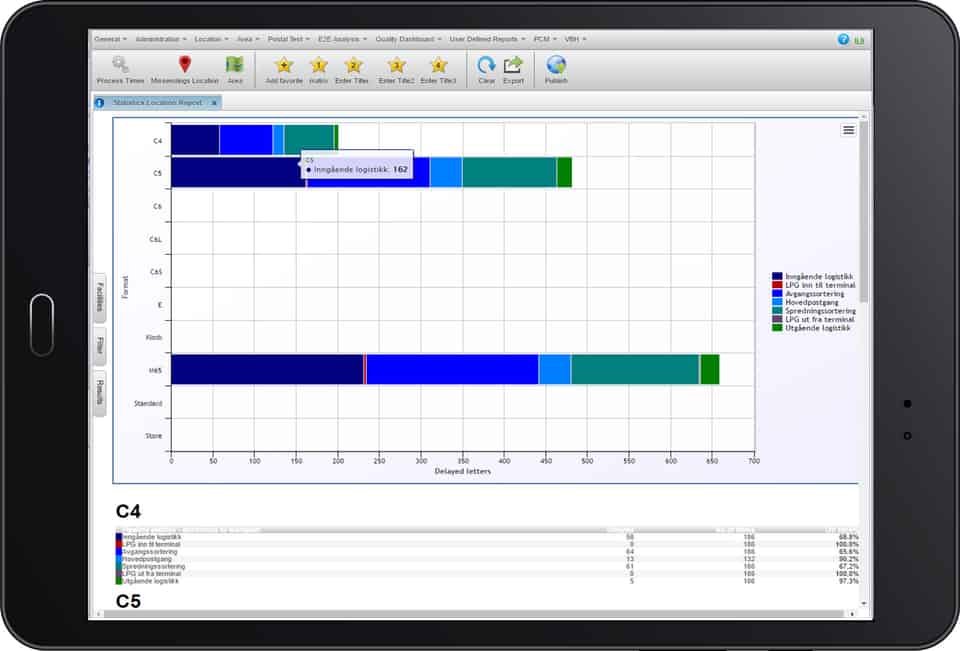
Trends and statistics
Trend analysis
Compare trends over time for different locations, areas, sorting centers, etc., and thereby identify where in the logistics chain problems occur.
Statistics
Narrowing down if any specific product characteristics are causing problems.
E2E KPI reports
KPI report library
The KPI report library is the location in Cloud QSM™ where the user in a single place – can view any type of KPI reports and dashboards available in the solution.
Report scheduling
The report scheduling engine manages the process of generating a KPI report in a selected file format as well as sending the report to the receiver by email.
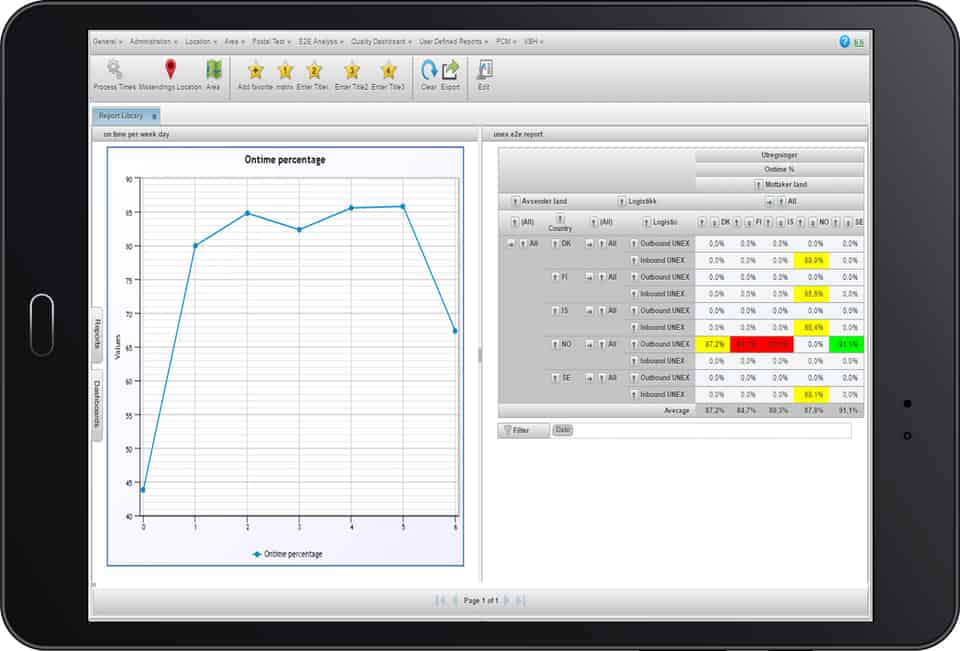
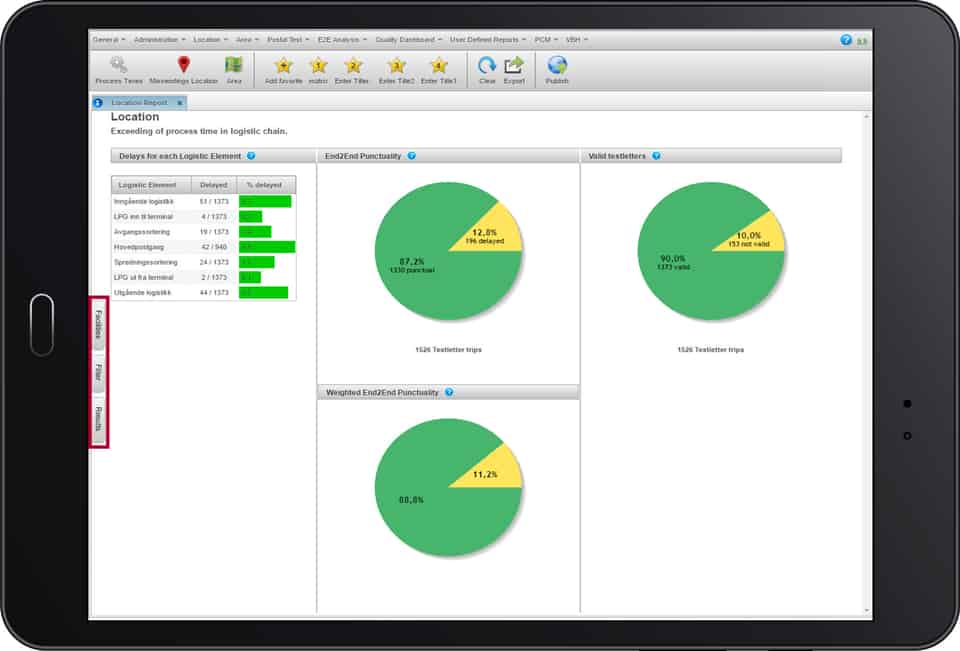
End-to-end analysis
Matrix report
Provides a full overview of End2End quality and shows exactly where delays have occurred.
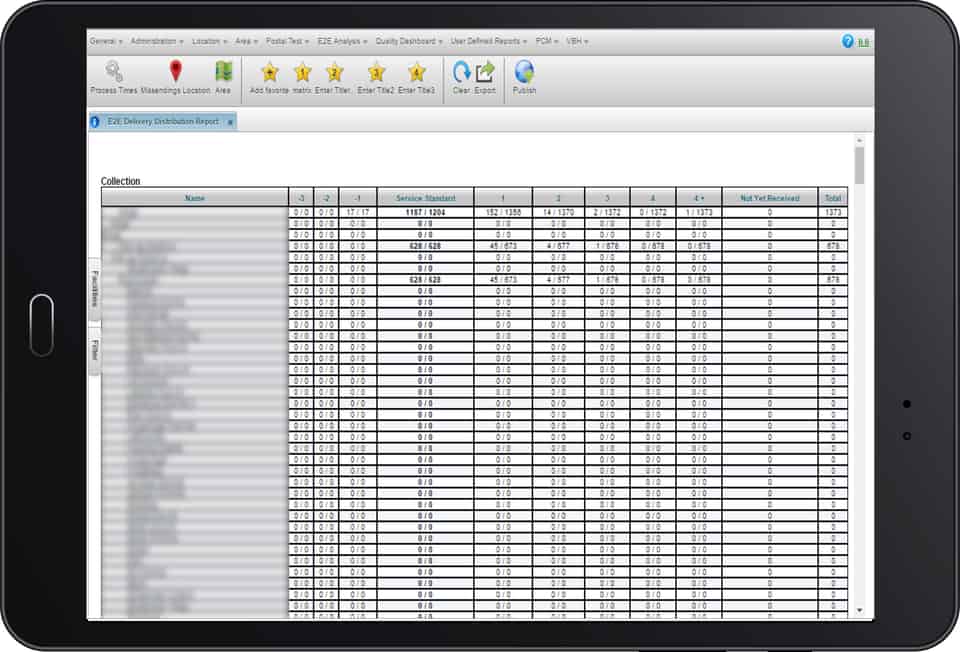
Delivery distribution
Provides an overview of how much of the delivered mail/product meets the service standard and how much of it was delayed, from 1 to 7 days.
Want to know how you can apply RFID and QSM into your process?
Then reach out at let us show you how it works

Learn From Others